According to the Bureau of Labor Statistics, the national average annual wage of a lawyer is $135,740. Employment of lawyers is projected to grow 8 percent from 2022 to 2032, faster than the average for all occupations.
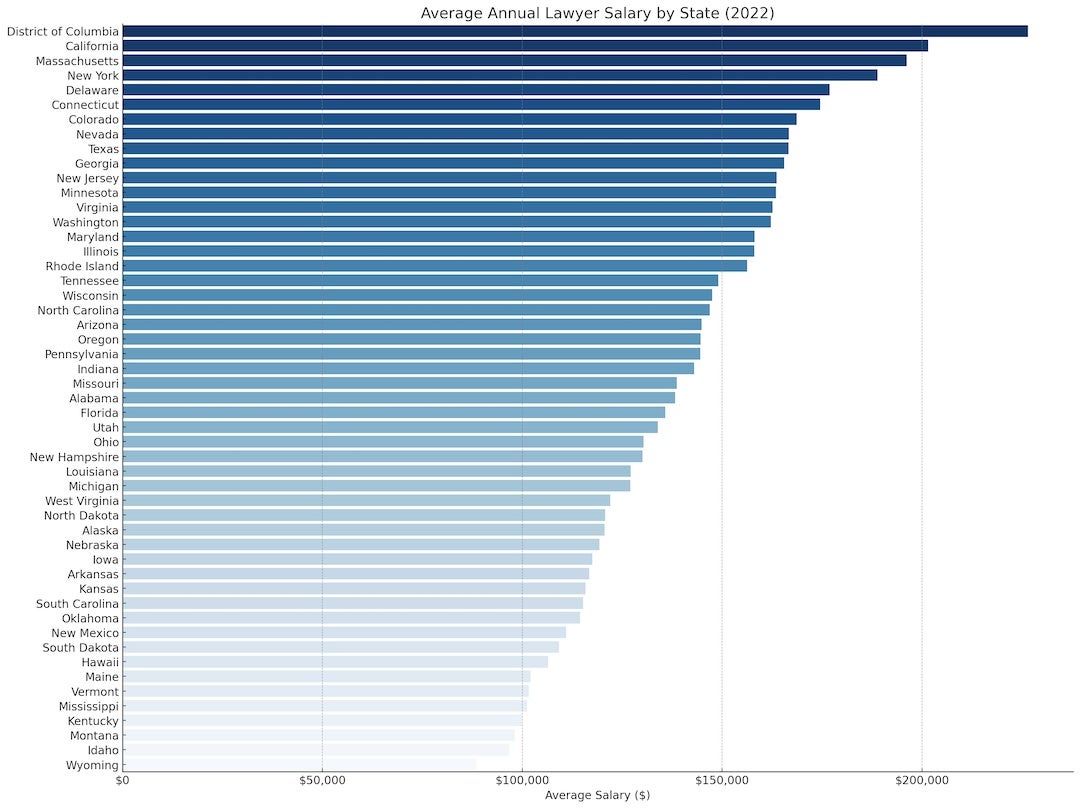
However, not all jurisdictions are created equal. In the highest paying state, California, lawyers' average salary is $201,530, or about $110,000 more than the average salary of a lawyer in Wyoming, the lowest paying state. The District of Columbia is ahead of California, with an average annual salary of $226,510.
The five highest paying states are California ($201,530), Massachusetts ($196,230), New York ($188,900), Delaware ($176,904) and Connecticut ($174,520). The five lowest paying states are Wyoming ($88,570), Idaho ($96,810), Montana ($98,170), Kentucky ($99,840) and Mississippi ($101,240).
The states that saw the biggest increase in average salary over the last 10 years are Rhode Island (+57.86%), Massachusetts (+46.03%), Indiana (+44.17%), Wisconsin (+40.40) and Tennessee (37.70%). The growth trajectory of the top 10 highest paying states can be visualized as follows: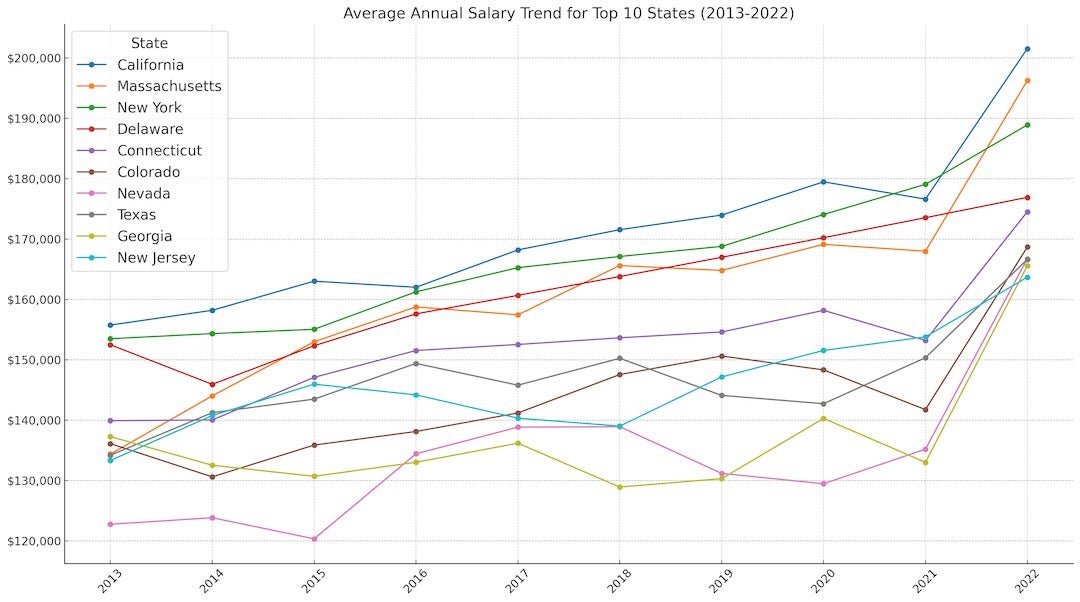
A full overview of the data is accessible below. Explore Legal.io's Salary Insights for more detailed data per role.
| Rank | State | 2022 Avg. Salary | 2021 Avg. Salary | 2020 Avg. Salary | 2019 Avg. Salary | 2018 Avg. Salary | 2017 Avg. Salary | 2016 Avg. Salary | 2015 Avg. Salary | 2014 Avg. Salary | 2013 Avg. Salary | 5-Year Change | 10-Year Change |
|---|---|---|---|---|---|---|---|---|---|---|---|---|---|
| 1 | California | $201,530 | $176,610 | $179,470 | $173,970 | $171,550 | $168,200 | $162,010 | $163,020 | $158,200 | $155,750 | 19.82% | 29.39% |
| 2 | Massachusetts | $196,230 | $167,980 | $169,120 | $164,800 | $165,610 | $157,450 | $158,760 | $152,990 | $144,030 | $134,380 | 24.63% | 46.03% |
| 3 | New York | $188,900 | $179,060 | $174,060 | $168,780 | $167,110 | $165,260 | $161,260 | $155,050 | $154,340 | $153,490 | 14.30% | 23.07% |
| 4 | Delaware | $176,904 | $173,531 | $170,223 | $166,978 | $163,795 | $160,673 | $157,610 | $152,330 | $145,940 | $152,490 | 0.00% | 0.00% |
| 5 | Connecticut | $174,520 | $153,200 | $158,190 | $154,610 | $153,640 | $152,540 | $151,540 | $147,100 | $140,040 | $139,920 | 14.41% | 24.73% |
| 6 | Colorado | $168,680 | $141,760 | $148,330 | $150,630 | $147,560 | $141,200 | $138,130 | $135,880 | $130,620 | $136,120 | 19.46% | 23.92% |
| 7 | Nevada | $166,740 | $135,200 | $129,480 | $131,190 | $138,920 | $138,850 | $134,440 | $120,360 | $123,850 | $122,770 | 20.09% | 35.81% |
| 8 | Texas | $166,620 | $150,350 | $142,730 | $144,110 | $150,250 | $145,800 | $149,400 | $143,490 | $141,240 | $134,200 | 14.28% | 24.16% |
| 9 | Georgia | $165,560 | $133,020 | $140,300 | $130,320 | $128,930 | $136,190 | $133,030 | $130,710 | $132,540 | $137,280 | 21.57% | 20.60% |
| 10 | New Jersey | $163,690 | $153,800 | $151,550 | $147,170 | $139,020 | $140,340 | $144,190 | $145,970 | $140,770 | $133,330 | 16.64% | 22.77% |
| 11 | Minnesota | $163,480 | $133,750 | $131,460 | $124,510 | $119,330 | $124,230 | $133,390 | $128,320 | $128,290 | $126,520 | 31.59% | 29.21% |
| 12 | Virginia | $162,640 | $146,140 | $151,970 | $143,220 | $139,180 | $136,790 | $139,050 | $135,180 | $131,320 | $129,800 | 18.90% | 25.30% |
| 13 | Washington | $162,200 | $136,210 | $131,530 | $129,550 | $136,480 | $129,220 | $126,900 | $124,000 | $120,740 | $119,900 | 25.52% | 35.28% |
| 14 | Maryland | $158,150 | $140,450 | $139,610 | $135,500 | $128,340 | $126,480 | $123,220 | $121,530 | $126,060 | $127,040 | 25.04% | 24.49% |
| 15 | Illinois | $158,030 | $148,280 | $153,720 | $157,010 | $152,980 | $140,920 | $129,070 | $125,920 | $124,680 | $132,910 | 12.14% | 18.90% |
| 16 | Rhode Island | $156,300 | $148,770 | $134,370 | $124,600 | $125,330 | $129,410 | $131,430 | $129,100 | $119,010 | $99,010 | 20.78% | 57.86% |
| 17 | Tennessee | $149,050 | $123,180 | $121,790 | $124,370 | $124,470 | $129,830 | $127,700 | $125,530 | $113,580 | $108,240 | 14.80% | 37.70% |
| 18 | Wisconsin | $147,530 | $131,630 | $124,410 | $129,440 | $130,450 | $123,600 | $111,080 | $101,990 | $101,980 | $105,080 | 19.36% | 40.40% |
| 19 | North Carolina | $146,890 | $131,960 | $132,190 | $133,290 | $129,990 | $137,200 | $138,470 | $123,940 | $118,310 | $114,840 | 7.06% | 27.91% |
| 20 | Arizona | $144,890 | $126,600 | $140,520 | $136,170 | $145,750 | $138,680 | $130,630 | $125,660 | $117,380 | $131,200 | 4.48% | 10.43% |
| 21 | Oregon | $144,610 | $139,520 | $128,160 | $116,860 | $119,500 | $117,810 | $114,730 | $117,800 | $114,870 | $111,640 | 22.75% | 29.53% |
| 22 | Pennsylvania | $144,570 | $133,330 | $139,120 | $142,890 | $138,610 | $139,050 | $134,600 | $131,090 | $129,460 | $134,250 | 3.97% | 7.69% |
| 23 | Indiana | $143,060 | $123,370 | $117,820 | $111,790 | $113,360 | $113,850 | $114,270 | $110,240 | $103,010 | $99,230 | 25.66% | 44.17% |
| 24 | Missouri | $138,680 | $126,940 | $111,020 | $109,820 | $113,780 | $115,520 | $116,060 | $114,480 | $121,500 | $116,190 | 20.05% | 19.36% |
| 25 | Alabama | $138,250 | $127,910 | $121,130 | $114,240 | $117,100 | $117,640 | $118,420 | $114,820 | $113,010 | $106,790 | 17.52% | 29.46% |
| 26 | Florida | $135,840 | $129,390 | $139,160 | $130,010 | $128,920 | $127,730 | $131,990 | $128,050 | $122,020 | $123,040 | 6.35% | 10.40% |
| 27 | Utah | $133,920 | $129,090 | $141,460 | $134,770 | $112,380 | $109,280 | $108,670 | $113,550 | $118,910 | $115,930 | 22.55% | 15.52% |
| 28 | Ohio | $130,320 | $122,550 | $128,170 | $124,160 | $121,520 | $113,610 | $113,400 | $113,360 | $113,200 | $108,950 | 14.71% | 19.61% |
| 29 | New Hampshire | $130,130 | $124,230 | $129,590 | $126,220 | $125,890 | $119,650 | $115,410 | $114,470 | $111,050 | $112,710 | 8.76% | 15.46% |
| 30 | Louisiana | $127,150 | $110,340 | $112,190 | $108,070 | $105,490 | $101,170 | $105,740 | $111,240 | $113,830 | $110,760 | 25.68% | 14.80% |
| 31 | Michigan | $127,030 | $121,780 | $119,150 | $116,310 | $110,180 | $112,740 | $110,760 | $110,920 | $116,710 | $114,460 | 12.68% | 10.98% |
| 32 | West Virginia | $122,070 | $107,380 | $109,290 | $102,040 | $98,630 | $95,220 | $100,430 | $98,270 | $94,010 | $90,240 | 28.20% | 35.27% |
| 33 | North Dakota | $120,780 | $107,190 | $113,480 | $113,280 | $107,290 | $97,680 | $102,660 | $101,840 | * | $90,850 | 23.65% | 32.94% |
| 34 | Alaska | $120,590 | $113,910 | $116,440 | $115,260 | $121,680 | $122,870 | $123,770 | $121,910 | $117,910 | $120,500 | -1.86% | 0.07% |
| 35 | Nebraska | $119,310 | $106,560 | $118,070 | $112,860 | $108,170 | $110,950 | $107,590 | $106,460 | $93,820 | $95,220 | 7.53% | 25.30% |
| 36 | Iowa | $117,500 | $117,580 | $122,400 | $119,700 | $112,630 | $113,470 | $108,660 | $106,820 | $106,080 | $106,920 | 3.55% | 9.90% |
| 37 | Arkansas | $116,730 | $107,750 | $94,800 | $94,000 | $98,780 | $99,100 | $103,980 | $100,320 | $100,690 | $101,340 | 17.79% | 15.19% |
| 38 | Kansas | $115,860 | $102,640 | $117,910 | $110,290 | $109,020 | $104,730 | $106,470 | $105,790 | $98,850 | $98,750 | 10.63% | 17.33% |
| 39 | South Carolina | $115,230 | $107,780 | $114,320 | $111,090 | $105,320 | $104,300 | $107,230 | $109,250 | $113,760 | $108,790 | 10.48% | 5.92% |
| 40 | Oklahoma | $114,470 | $105,370 | $122,040 | $116,270 | $118,790 | $115,260 | $123,510 | $116,900 | $112,520 | $101,310 | -0.69% | 12.99% |
| 41 | New Mexico | $110,970 | $116,220 | $107,700 | $103,290 | $105,910 | $99,510 | $97,100 | $91,430 | $96,520 | $98,150 | 11.52% | 13.06% |
| 42 | South Dakota | $109,190 | $100,100 | $111,930 | $112,810 | $109,070 | $100,000 | $101,360 | $96,580 | $98,360 | $99,650 | 9.19% | 9.57% |
| 43 | Hawaii | $106,520 | $102,090 | $114,520 | $109,420 | $111,290 | $113,190 | $106,650 | $104,180 | $105,410 | $108,820 | -5.89% | -2.11% |
| 44 | Maine | $102,060 | $100,890 | $98,980 | $106,350 | $107,120 | $102,040 | $106,270 | $99,260 | $100,720 | $93,940 | 0.02% | 8.64% |
| 45 | Vermont | $101,610 | $94,810 | $100,950 | $104,790 | $107,490 | $105,900 | $103,970 | $106,610 | $101,620 | $98,580 | -4.05% | 3.07% |
| 46 | Mississippi | $101,240 | $97,440 | $93,380 | $95,040 | $97,990 | $106,360 | $114,710 | $103,180 | $99,470 | $92,640 | -4.81% | 9.28% |
| 47 | Kentucky | $99,840 | $96,940 | $105,130 | $102,980 | $100,100 | $95,890 | $93,020 | $93,560 | $92,090 | $90,200 | 4.12% | 10.69% |
| 48 | Montana | $98,170 | $96,200 | $93,220 | $83,030 | $88,600 | $83,150 | $83,330 | $82,070 | $75,720 | $75,360 | 18.06% | 30.27% |
| 49 | Idaho | $96,810 | $99,740 | $108,470 | $105,450 | $99,360 | $98,390 | $91,390 | $96,900 | $100,900 | $105,380 | -1.61% | -8.13% |
| 50 | Wyoming | $88,570 | $92,410 | $102,810 | $100,090 | $105,600 | $98,090 | $112,710 | $102,130 | $103,290 | $89,280 | -9.71% | -0.80% |
Source: Occupational Outlook Handbook published by the Bureau of Labor Statistics.